
On August 2006, an ambitious project was unveiled at the Museo de Buenos Aires (Buenos Aires’ City Museum). It was a digitization program that promised to give the public access to one document that was equally important and unknown: Beare’s Cadastre.
Ironically, just a few years after the project was finished, it became almost impossible to get a copy of the material. Personally, it took me ten years to be able to get a copy of the cadastre, something that happened almost by chance when I visited the Buenos Aires’ City Museum.
After a few minutes using the interface created for the material I realized that it would be a nightmare to access the information. The aesthetics had been prioritized over the usability, and that quickly got me thinking: “There has to be a better way”.
I decided that it was possible to create a product that, not only would be more accessible for the general public, but also, could be more dynamic for the researcher and at the same time be friendly to anyone trying to incorporate the information into an online database.
In this article I will do a small recap on the Cadastre’s history and why is so important for anyone researching Buenos Aires. On a second part I will detail how the material was initially available and all the problems that this original presentation had.
On the last part I will detail the transformation I applied to the Cadastre and how I was able to achieve a new and unique, never seen before, presentation of the Beare’s Cadastre. And if you cannot wait to get the Cadastre for yourself, do not leave without checking the STORE.
Beare’s Cadaster
In 1852 Argentina commenced a new era of profound political and social changes: the political power, once held by the provincial government under the Caudillos, started to be centralized around a Federal Government, which finally was able to achieve the monopoly of legitimate violence. This was, mostly, the result of Buenos Aires being able to gain total control over the customs and the revenue that it generated, which was the main source of income for the country.
Under this new order, the city of Buenos Aires was the main winner. After the fall of the conservative Governor Rosas, the power went to the liberals who opened up the country to the commerce and foreign capital investment. This capital influx was the catalyst of an urban transformation that could only be compared with the changes suffered by Dubai in the last decade of the 20th Century. The city left behind its colonial origins and started a path that would make it one of the biggest and most important cities in the world.
The Beare’s Cadastre is a direct product of power centralization, which allowed the government to exert power over its citizens and plan the future of the country’s cities and its inhabitants.
Before this the city of Buenos Aires only had had one census, in 1855. And although many maps had been created during the previous decades, none did a precise and systematic inventory of the properties and its owners. The cadastre, then, become a fundamental tool for the State to determine the amount, extension and characteristics of all the properties which could be taxed.
European ideals had been rejected while Rosas held power. Among these ideas was the new urbanism that championed a proper city planning as a way to improve hygiene and its habitability. A cadastre was a fundamental tool in this kind of developments since it allowed the urban planners to visualize the city and its challenges.
The Engineer Peter Beare, born in England in 1825, and who had arrived at Buenos Aires in 1857, saw clearly the need for a cadastre for the city. He proposed to the Government of the Province of Buenos Aires the idea for such an endeavor by saying that the city: “had changed so much its buildings in the old neighborhoods, and the heirs of property had fractioned it so much that I consider necessary to make, as much as possible, an exact survey that would represent these alterations and the rise in wealth that they represent”.
Beare’s proposal was green lighted surprisingly fast. His letter, sent on July 11th, had an affirmative answer just nine days later. In the letter sent by the government to Beare it was indicated that he had to produce 12 volumes that would cover each one of the neighborhoods (called ‘parish’ then, because each one was determine by the area covered by a church), and also there had to be: “one reference book which had to compile all the knowledge and necessary details for the better application of the ‘Direct Contribution Tax’ and all the other municipal taxation”.
This may be a clue to why the project was very welcomed by the local government.
Beare started his work in 1860 and continue working on the cadastre for ten years, albeit he did other jobs in parallel. In 1870 the 14th and last volume was concluded, meaning that at some point during the process another two volumes were added to the original request for twelve.
Tragically, Beare’s life was cut short one year later when he drowned during the sinking of the ship “America” which was taking him and his family to Montevideo, where he was living at the time.
The Cadastre that unofficially bears his name is an imposing work, even for those who are not familiarized with the importance it carries.
The fourteen volumes are stored at the Buenos Aires’ City Museum, inside a wooden cabinet for safeguard that was costume made, something that is necessary if we take into account the huge size of each book, measuring 50 by 70 centimetres (19 by 27 inches).
Since it was created as a tool for the government to catalogue and tax the citizen’s property it is no surprise that nobody had ever thought of creating a copy for public distribution.
The fact that this document is unique and no other copies had ever been produced (in any format) makes the Cadastre the perfect candidate for digitization.
This made the cadastre a unique piece of art. A backup copy was only created in 2006 with its digitization, and although that process faced a big number of technical difficulties and produced some less that good results, we cannot deny the importance it entailed for the protection of the cadastre.
The 2006 digitization
The digitization technology had leaped forward in the last few decades. This, with the wide use of Internet and the rise in its bandwidth had helped opening a new world of information for the public to access.
Sadly, in Argentina the kind of initiatives that would help grant the public access to the information were few and poorly organized. But of those few that had progress, maybe because they were small in number, proved to be extremely important. The digitization of Beare’s Cadastre was one of such initiatives.
Pictures of every illustration from the 14 volumes were taken for the digitization process. Sadly, the quality of the images varies greatly, and while some files have great details others files had a lower resolution that made the recovery of the information, such as lots numbers, very hard and, sometimes, even impossible.
Although we must not minimize the importance of this digitization process, we cannot but notice that it was poorly organized, lacked a clear plan and, would not surprise anyone if we discovered that the team executing it lacked the technology or budget required to complete their task.
The problems I just mentioned cannot be solved in any other way than by a new process of digitization. This should be an immediate priority for the Cadastre’s guarding institution: the Buenos Aires’ City Museum. Luckily, the emergence of new technologies (like AI up-scaling) could prove to be the answer if the guardian institution does not take the proper steps to ensure a new digitization.
Aside from these, currently, unsolvable problems, there were other problems with the 2006 digitization that could be solved, like the poor interface created to interact with the information.
I will proceed to show this interface to shed some light in the problems that moved me to start this project.

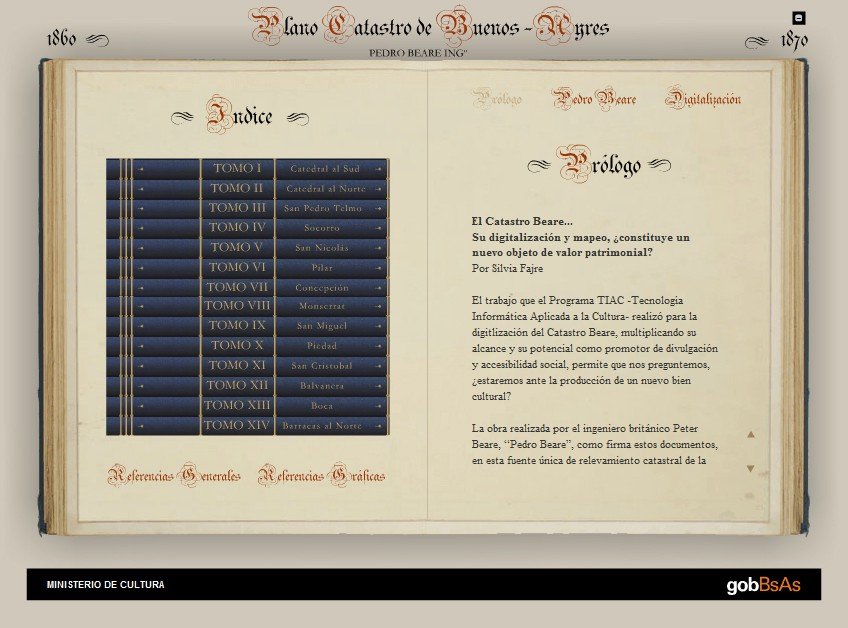
All the digitized data was loaded into a single DVD and to access it one had to use an interactive platform designed with Adobe Flash. The idea seem to had been that the person accessing the information would have had the same experience as if they were reading the physical books.
It shows that the designer had in mind beauty over ease of access to the information. Only someone with a passing curiosity would find this method acceptable to use. Just to show one example, take the introductory screen, which is impossible to skip and shows a 15 second animation every time the platform is launched.
Once the intro is passed then we are welcomed by a menu that displayed the 14 books as if we were seeing them in a library. As you can see, in the following illustration, there is no reference to which are is covered in each volume. This presentation, although very beautiful, is of no use to anyone who wanted to use the information for a research.
Image 1
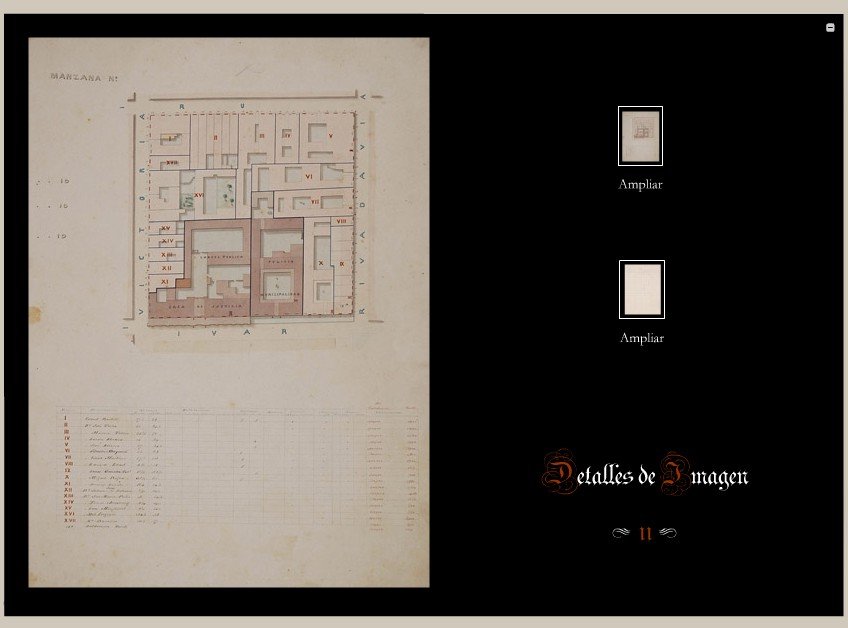
To make thing worse, once you clicked in the volume you wanted to see you would be taken to new window were the content of the book was preview. But the image presented to us was very small (especially if we take into account the size of the original documents). This visualization could give us an approximate idea of the content but it was too small to be of any practical use.
Image 2

In order to access the individual page, one had to click on that page’s image thumbnails (displayed below the screen in Image 3) and that would open yet another window. This time the image would be shown to us in a bigger size, although not big enough. To access the full-size image, it was necessary to click on any of the two thumbnails that are shown to the right in the following image.
Finally, once we had clicked, the image would open in its full size. But things were not over yet. The image was displayed at its maximum zoom level, and it was impossible to do a zoom in or out, the display was locked and one had to move the image around. One can see this in images 4 and 5.
Image 3
The reader can only imagine the complexity and cumbersomeness involved in this process, which had to be repeated every time one wanted to check an image. Contrasting and comparing between two blocks of the city, was impossible, as well as reading the owners and lots information at the same time that one checked the lot diagram (which, ironically, was the main reason for the Cadastre to ever be created).
To make thing worse (if all this was not worse enough) there were no indexes. The new layout of the pages did not respect the original index that accompanied every volume and those making the digitization never created and index of their own.
If one wanted to find a particular lot, in a particular block, in a particular street the only way to do it (especially for those not familiar with the layout) was to check over and over again until hitting the right page.
This problem is displayed in Image 6. We can see that the first block of the original index from volume II (down and left) were marked with the number I. But they are now displayed as images 5 and 6 in the thumbnails shown at the bottom.
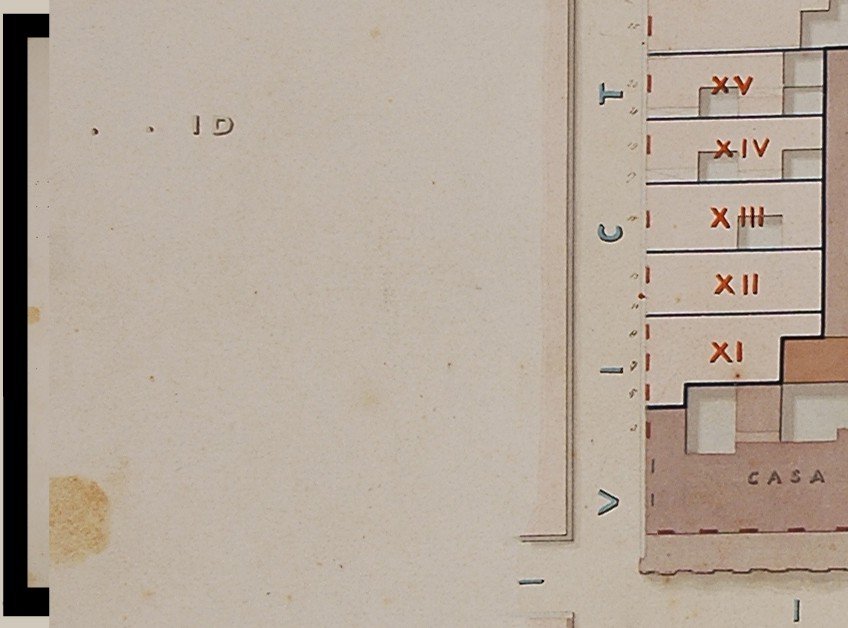
Image 4
Image 5

To this problem we must add that the user had no way to export the images and save them. All the information was contained within the Flash files, which were inaccessible to the average user.
This series of problems made using the cadastre interface unfriendly and almost nightmarish experience. The impossibility of saving the files were also a brick wall that negated the possibility of achieving my goal, which seem the logical next step once the cadastre was digitized: unify all the images into a single image that encompassed all the volumes.
The Unification of Beare’s Cadastre (2016)
The first challenge I face was “unpacking” all the Flash files, which, luckily, were not encrypted nor password protected, only compiled into a proprietary Adobe container file. This task was simple, with a freely available Flash de-compiler I was able to retrieve all the information stored within each of the 14 files that contained the information for the individual volumes. After that, the only thing left to do was to identify the useful images while discarding all the thumbnails and lower resolution files.
When this stage was finished I found myself with a big number of JPG files indexed in one folder for each volume. This allowed me to use the information with complete freedom in any application I desired.
One interesting detail that I discovered once all the information was extracted from the Flash files was that there were eight blocks that were surveyed twice. Once, in volume one; and then again in volumes eight and nine. The interesting detail about this double survey is that the first volume was completed in 1860 while the two other were finished ten years later. This gave us a glimpse in the urban evolution of those blocks during a ten year period of time.
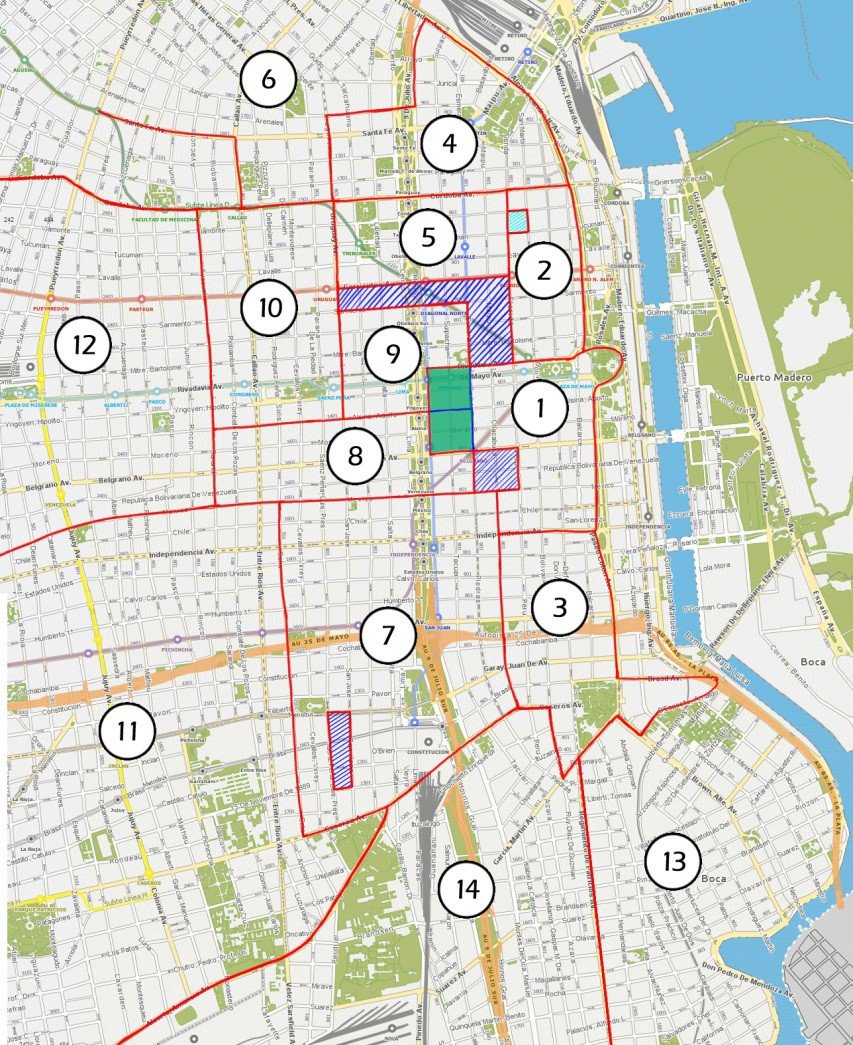
The next step was to create an index that would allow the user to quickly and easily locate any file they needed. First, it was necessary to check exactly the area covered by each volume and then mark the boundaries over the official map of the City of Buenos Aires. And extra index was created, at the root folder, that showed the complete area covered by the whole Cadastre and which area corresponded with each volume. This would work as the general index.
Image 6
Once this was done, retrieving information became a very easy task.
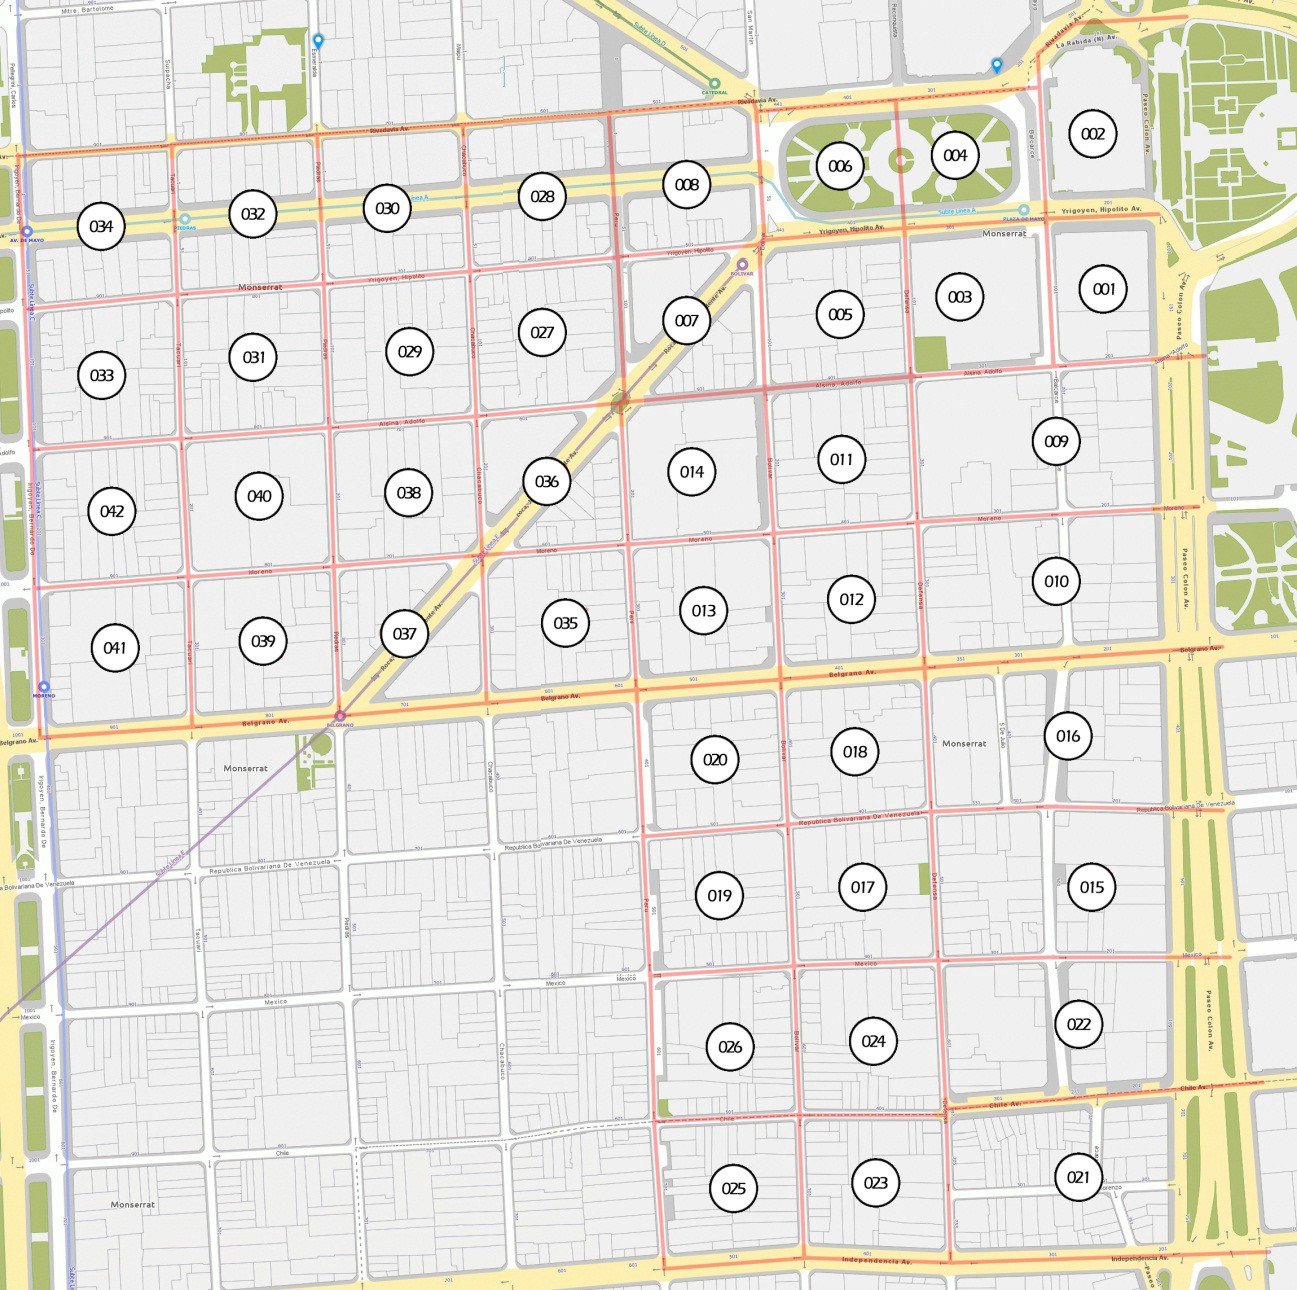
Image 7
The new system I developed had in mind the ease of use and to reduce as much as possible the time needed to locate an individual block. Each image was numbered and the area covered by it was displayed over a current map of the city.
This may not seem too important in the downtown area, where each illustration usually covered one block, but the farther away we move from the city centre, the wider the area covered by each of the illustrations.
Also, the use of a current map of the city as the reference will help the user to find a quick parallel between the present and the past (which is something especially useful in areas that had significantly changed through the years).
Once I reached this point I was ready to start thinking the next step.
I started working with the first volume, which covers the southern part of the historical city’s downtown. On my first attempt I simply lined up the blocks following their location in the city’s grid, without using any other reference.
This approached soon proved to be problematic. Even when Beare’s work was extremely precise it was not perfect, and the accumulation of minimal variations and imperfections in the blocks size, soon piled up and started breaking apart the correlation between each one of the blocks. A quick assessment showed that if I proceeded with this, once all the block were in a single file, the distance between the edges of the new plan would be completely off and would be impossible to correct.
A new approached was needed if I wanted to achieve an internal correlation between all the images.
With that end in mind I decided to use the current map of the city as the template over which I could “mount” the images from Beare’s Cadastre. The official map of the City of Buenos Aires is available on Internet and is based on the 1940s Cadastre, which had achieved extreme precision, and proved to be the perfect base for my task.
Once I had scrapped my previous attempt I restarted my work with the first volume.
Image 8

The first obstacle I found was that there was no way to extract the information from the current city map into a usable file, even when this information is public and freely available. The only practical process I could devise at the time was to screen shoot every single area I was going to need and then assemble them into a file to be used as a template. Once this was accomplished the second phase could commence.
On this stage, I started placing each image form the Cadastre over its correspondent blocks in the current map of the city. Soon the same imperfection that had thwarted my fist attempt started to show up again. Almost no block could be aligned perfectly over the template so tweaking was needed in order to achieve what I was looking for. I had to “deform” each image from the cadastre until the imperfections where ironed out and a nearly perfect alignment was possible.
Image 9
Something that I had to remember is that the city grid has sustained some changes during the last century and a half. Since the block’s size could be deceiving, it was necessary to compensate the urban modification, using any clue as a reference. For example, the lots sizes and shapes, in some cases, had remained unchanged, even when the original buildings were demolished or the whole block had lost a percentage of its surface.
This process had to be repeated one by one with every single file from the cadastre. None matched perfectly.
The difficulty only increased the farther I got from the city’s centre. Some illustrations could cover up to ten blocks (while the city center’s one only covers one or two). This gave me less point to use as a reference between the present and the past. The Riachuelo basin and “La Boca” neighborhood, to the south of the city, was, perhaps, the most difficult part of them all. These areas were barely urbanized by 1860 and on top of that, the whole topography of the area had significantly changed in the last 150 years. I had to do deep research on the area and its changes in order to achieve a reasonable degree of alignment.
Once the initial test run showed that the process was promising, I felt confident to move for the next volume. I was forced to create a single file per volume, since technical limitations with my computer did not allow me to work with a single file for the whole cadastre. Since I was using the current map of the city as a template, I was sure that, even if I had to divide my work in different files, once it was done and I had to assemble them, they would match.
The whole process of superimposing the cadastre’s files over the template took me around one year.
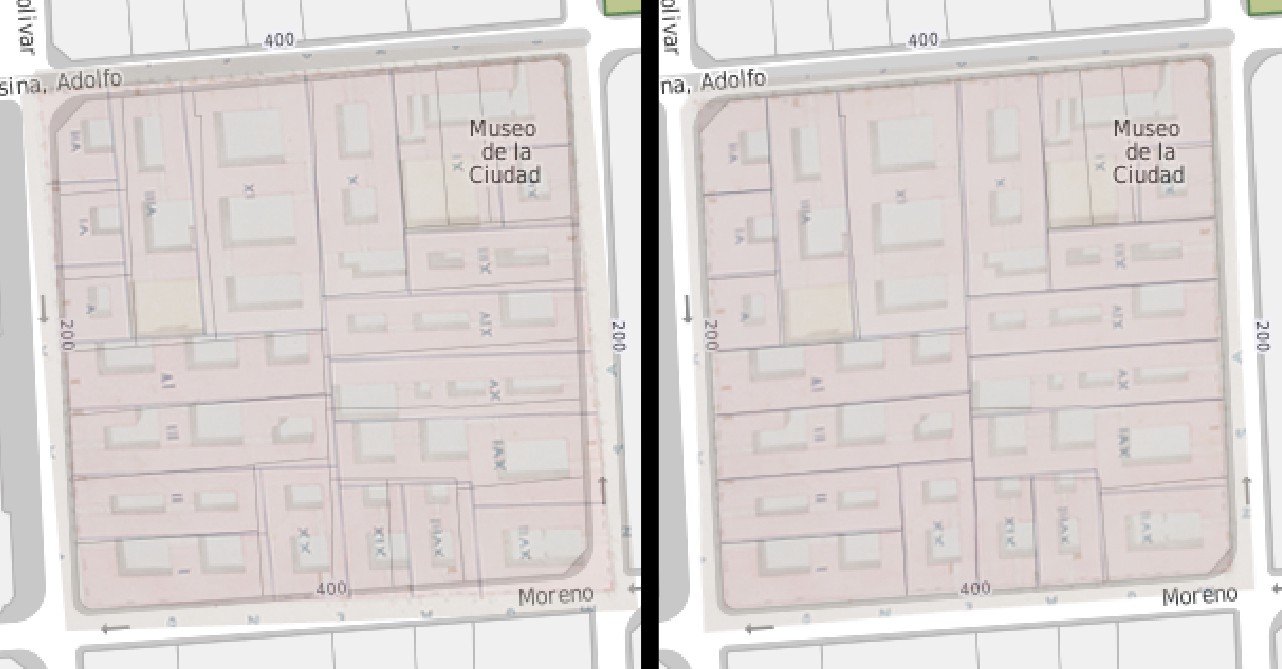
But this was not the end of it. While I was “deforming” the images in order to make them fit the template, a secondary effect crop up. Since the images had been changed by the fitting process, they did not connect properly with each other, and the underlying template started appearing trough the image’s joints. This can be seen in the next image.
Image 10

This was unavoidable, but created an unpleasant look to the whole map. I had to correct this.
The solution was to use my Wacom tablet to paint each one of these transparencies, trying to respect the original colours and blend those images that had different colour pallets (something that happen not only inside single volumes but was sure to happened among illustrations done years apart). I did not wanted to do a colour correction of the images to make them match, so I choose to apply a gradient between the different colours in order to achieve a pleasant look while maintaining the original colours, achieving an organic blending.
Image 11

This phase of the project demanded another year.
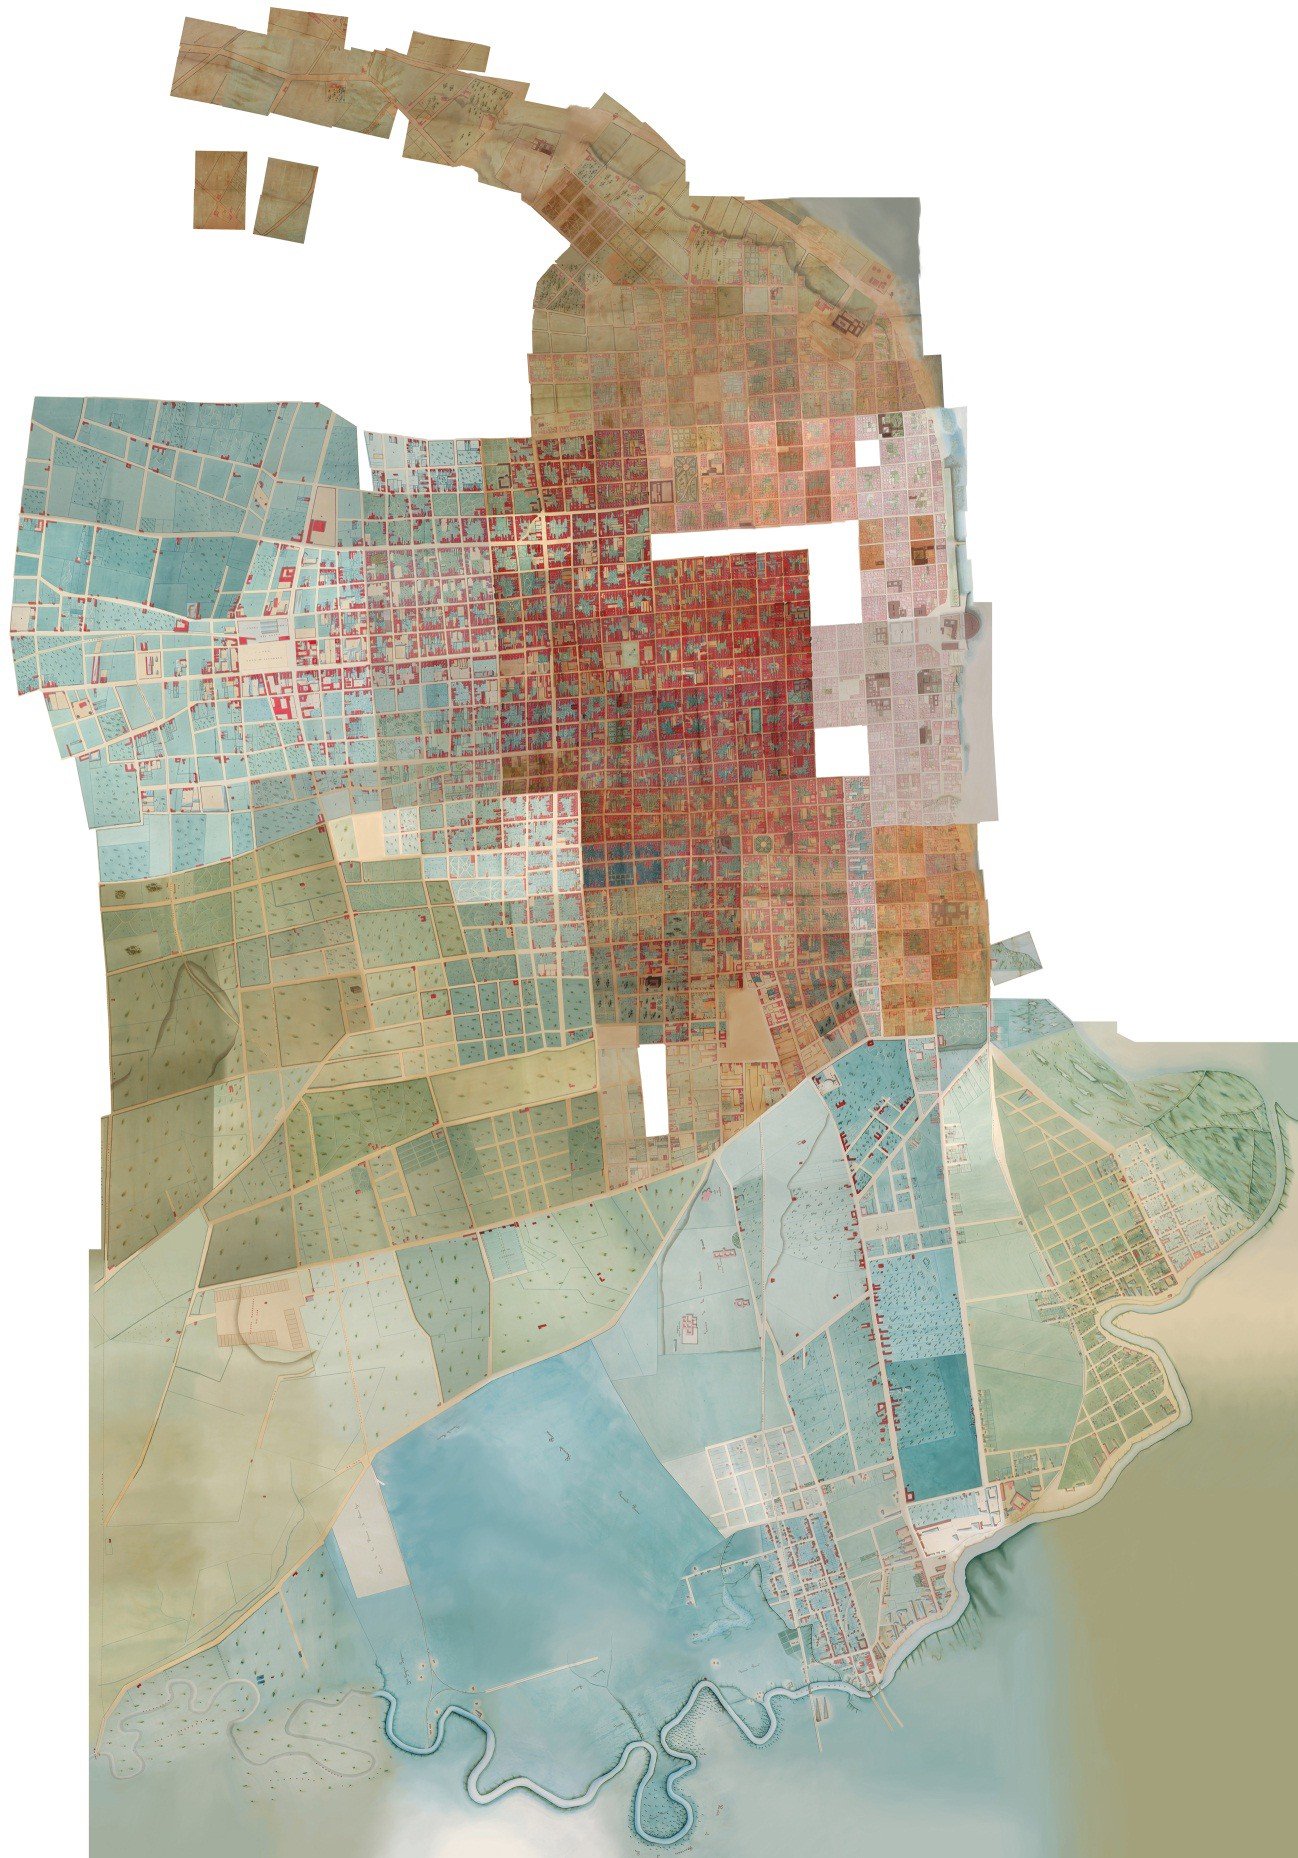
Once this process had been applied to all the volumes then it was time to start the last step: the unification of all the fourteen files into a single illustration. This was the moment of truth, when I was going to know if all my calculation were correct. Any mistake could ripple through the whole thing and demand a fresh start.
On top of this I had to face the technical limitations of my computer. Handling the files for each single volume proved to be highly taxing for my CPU. System crashes were very common with frustrating loose of information that sent me back to my last save file (needless to say, I saved a lot).
After several tries, and spite the technical problems, I started the unification. This compilation created a file that was nearly a gigabyte and its size was of 46k by 34k pixels.
After two years I was able to see, with my own eyes, what I had imagined for so long ago. In a world where everything seemed to have been already discovered, it was an enormous privilege to being able to see the whole city of Buenos Aires as it had existed between 1860 and 1870 in a way that nobody else had ever seen it.
Now this documentation is available for the public. To the original digitization I have added not only the unified cadastre file, but I have re-indexed all the images, corrected all the owners and lots information (to the extent it was possible), created individual indexes for each volume and a global index for the whole cadastre; and finally, I geo-referenced the unified image into Google Earth, creating a very pleasant and accessible experience when consulting the information.
I can now look back and feel that this whole effort was worth it, that I have added value and layers to this information that, for a time, I feared was condemned to be lost forever.
get your own copy of the cadaster in the page’s STORE or by sending me an email at: facbsas@gmail.com
Image 12
Bibliography
Lima Gonzáles Bonorino, Jorge F — La Ciudad de Buenos Aires y sus habitantes (1860–1870); Instituto Histórico de la Ciudad de Buenos Aires (2005), Buenos Aires.
Memorias de la Municipalidad de Buenos Aires (1859); Buenos Aires, 1860.